Part I: Data Sources
My research interests lie in the patenting differences between large & small firms – and more importantly how can a small firm with relatively smaller resources get “more for their money” by having more valuable patents.
Those in the patent field realize that small firms have less experience than large firms, as measured by filed applications – but by enough to statistically compare the two groups? We must determine that before moving forward.
Data Source: The data collected was tested using patent data collected for US patents granting in January 1999[1] within the International (IPC) patent classes related to Electrical Devices (H01) and Mechanical Devices (F16). These particular classes were chosen as they were relatively opposite technically based categories allowing for a clear comparison across industries. A total of 847 samples drawn from the USPTO with both expired patents and those granted to non-US based firms removed from the sample. The remaining 386 samples were coded into Small and Large Entity status, as listed by each patent application record available from the USPTO.
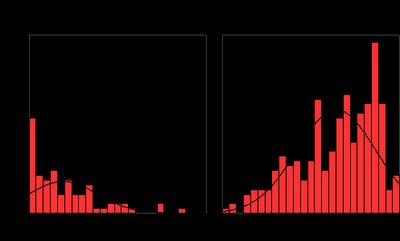
Small and large firms patenting experience distribution, as measured by filed applications.

With negative skewness (-0.58) and kurtosis (-.457) for the large firms and positive skewness (1.25) and kurtosis (1.452) for the small firms, it can be seen that small firms have less experience than large firms, as measured by filed applications
(Sorry the background is black but SPSS was doing wierd output that I couldn't fix when importing into blogger - you need to click and open it to see the graph.)
So, with this difference in experience established in statistics we can move to comparing the two small & large firms patents.
Next: Part II – Patent Variables to measure internal patent value. I will be using claim count, patent breadth, patent jurisdiction size, number of claims, provisional basis and priority claims as my variables of value.
[1] A data-set from pre-November 29, 2000 was also consciously chosen as the law of the US now requires all US patent applications filed on or after this date to be published 18 months after the earliest filing date for which the benefit is being sought, unless the application will not be filed in a foreign country that provides for 18-month publications. Data collected after this date would cause issues as there would effectively be 2 data sets to consider: citations granted applications that had an earlier publication date and citations for granted applications that were not published.